I talk to a lot of analysts every day – product analysts, data engineers, web and digital analysts, CRO managers and growth hackers. When discussing the next analytics project, people are ready to spend days describing the complexity of the implemented data pipelines, the peculiarities of using such wonderful platforms as dbt, Dataform, the endless variety of tools inside GCP, AWS and Azure, and the opportunities they provide them.
And I really like discussions with that people! What they are actually doing, how do they achieve things they wanted to achieve. Sometimes people from data act like a stealth warriors, but then prepare a comprehensive analytics infrastructure, which then can be used by business for decision making process. Yeah, it is hard to overestimate the value of this activity.
But in this post, I want to speak not about data pipelines preparation, but about actual role of digital analyst, and maybe about actual opportunities, which currently we have.
Originally, I’m from sociological sphere, where I spent about nine years, studying quantitative sociological methods, applied statistics, successfully completed Bachelor’s and Master’ programs, and defended my PhD thesis. And one thing which was always a problem for me, it is how to collect data, which will help me with my sociological researches. In some cases, my dataset could be just one table with 300-400 rows and less than 20 columns. It was relatively straightforward sets of data with simple structure and no complexities. But even there, we had a chance to apply different statistical methods, worked with correlation analysis, PCA, factor analysis, linear and logistic regression, and did a lot of other things.

Then I came to digital analytics industry, and started working as a social media analyst and web analyst on various projects. The biggest surprise for me was to observe, that with almost endless opportunities from the perspective of available volumes of data (millions of rows of data can be a dream for sociologist, but daily routine for person working with Google Analytics) specialists in that industry mostly limit themselves with descriptive analysis, focusing significantly more on data tracking implementation then on further analysis.
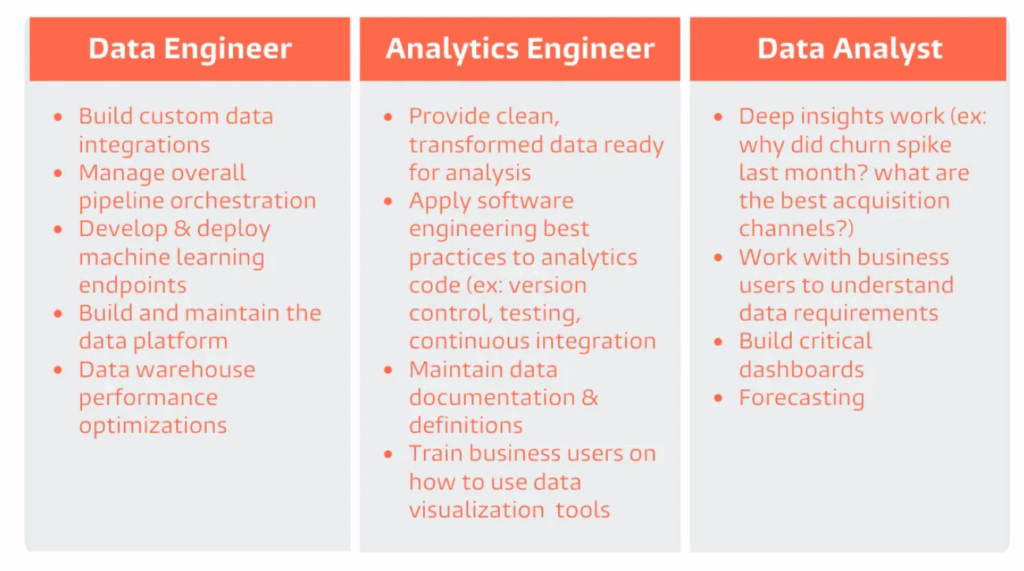
Such framework makes sense from the perspective of dbt’s classification of data-related roles. People, involved in web or mobile analytics, or placing positions like digital analytics consultants or technical marketers, can be classified as Analytics Engineering specialists, who help with preparation of ready-to-go analytics infrastructure solutions, then used by other parties (or by mythical “true Data Analysts”…).

But how that analytics solutions can be used?
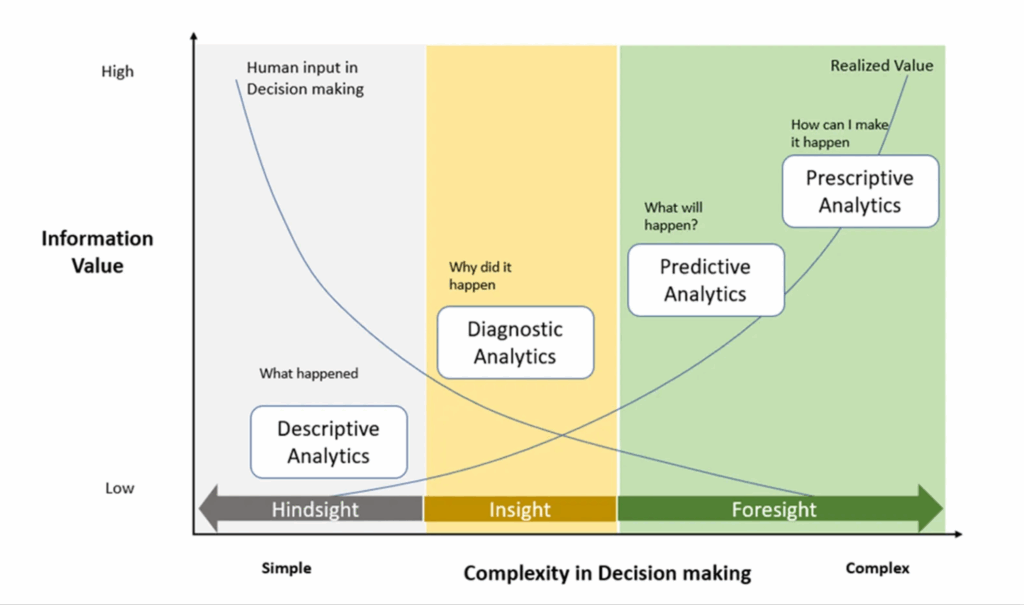
Based on Gartner’s analytics maturity framework, there are various levels of analysis, starting from basic ad-hoc descriptive-like requests up to predictive and prescriptive approaches:

From the first glance, all of that levels currently covered by usual digital analytics routine. Descriptive level is presented on all current reporting solutions (no matter it is standard UI graphs in Amplitude or custom data visualizations in Tableau). Predictive level is also currently not a cutting-edge story: in BigQuery you can utilize k-means or regression algorithms in SQL quesries directly, and some BI tools like Looker support forecasting as a built-in feature.
A black-hole item here is a diagnostic-related step. Sometimes, when I hear from people that they are responsible for reporting and insights-digging activities, I usually ask how this process looks like. Answers vary: sometimes it is bar charts viewing combined with business domain understanding, sometimes – calculation of key metrics separated by user segments. In some cases my companions can speak about concepts of null and alternative hypothesis, normal distributions – but mostly linked to conducted A/B tests.
I would not deny an idea that in diagnostics analysis the key skill should be an ability to ask question “why?” as frequent as possible – linked with business domain understanding, it should be a major source of “step-forward” decisions. At the same time, addition of applied statistics to basic formula “questioning + domain understanding” is a relatively big area of opportunities for data analyst.
When he or she already has access to raw Google Analytics data in BigQuery, and data is already prepared for metrics calculation, there is already everything ready-to-go. You can either use build-in BigQuery CORR() functions or connect your dataset with Colab and utilize Python scripts – and it already opens a window of new options (and challenges) on how to play with your data. In 90% cases it be like a session in a sandbox with no visible outcomes – but remaining 10% can be a game changer (or, of course, not).
In some of my next posts I will try to dive deeper into that journey – based on basic GA4 & BigQuery stack, I will try to tell how to power-up data and extract something new with that – even if it can be something basic from the perspective of variety of applied statistics methods. Wil see if I will have enough motivation to do anything for that – but never say never!