For last few weeks I’m obsessed with Kaggle: https://www.kaggle.com/ – a platform for data scientists, ML/AI engineers and data analysts. For significant share of people it is one of entry points in a machine learning world – just because of infinite variety of competitions, datasets, examples of notebooks and relatively strong community.
I registered on Kaggle 9 years ago, when I just thought on what to do after university graduation, but that time I didn’t have enough motivation to do anything. I’ve made that time one or two notebooks, tried to participate in a classic Titanic competition – and forgot about all that things there.
Honestly, even for now ML is not my strong part – OK, I can work with regression models, understand basic metrics like RMSE or F-score, but various types of boosting models, existence of ensembles and k-folds is still a new non-covered world. I like checking how other people do some breathtaking things, and jelous that my skillset is not good enough to do the same.
At the same time, one thing inspired me last week – I decided to combine my Python data analysis knowledge with my interest in video games history. Kaggle provides an enormous volume of different datasets, and some of them are related to video games too. So, I composed 3 different Jupiter Notebooks with dedicated purpose, and, I hope, some story.
A Golden Era of Point-and-Click Adventures
URL: https://www.kaggle.com/code/lunthu/a-golden-era-of-point-and-click-adventures
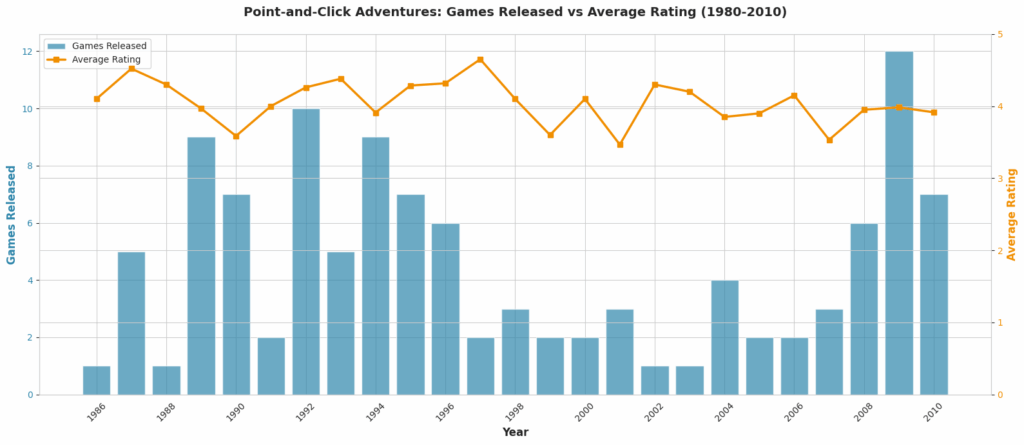
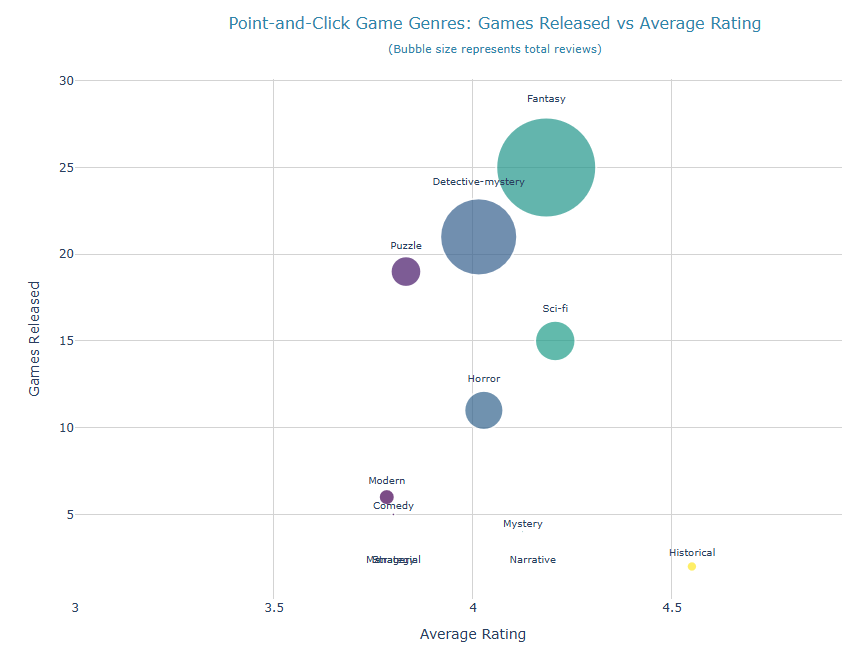
In this notebook I used my own dataset – it is a data from GOG.com API I mentioned several posts ago. I decided to upload that data to Kaggle, and then to compose a story about evolution of point-and-click graphic adventures, based on games available on GOG.com, of course.
While there is not so much space for predictions in that dataset, it is still interesting to check different trends and patterns in games distribution by topics and over years:
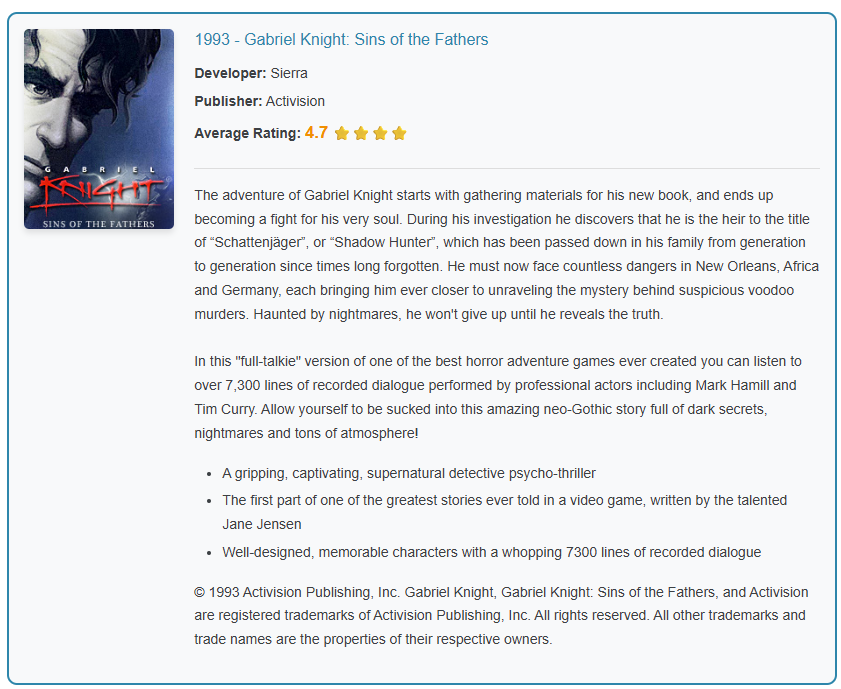
My favorite part of that notebook is a visual scorecard for the best game of each year – it is generated with HTML code, and descriptions I grabbed from GOG.com pages with usage of BeautifulSoup:
Rise of Strategy Games in Steam
URL: https://www.kaggle.com/code/lunthu/rise-of-strategy-games-trends-texts-analysis
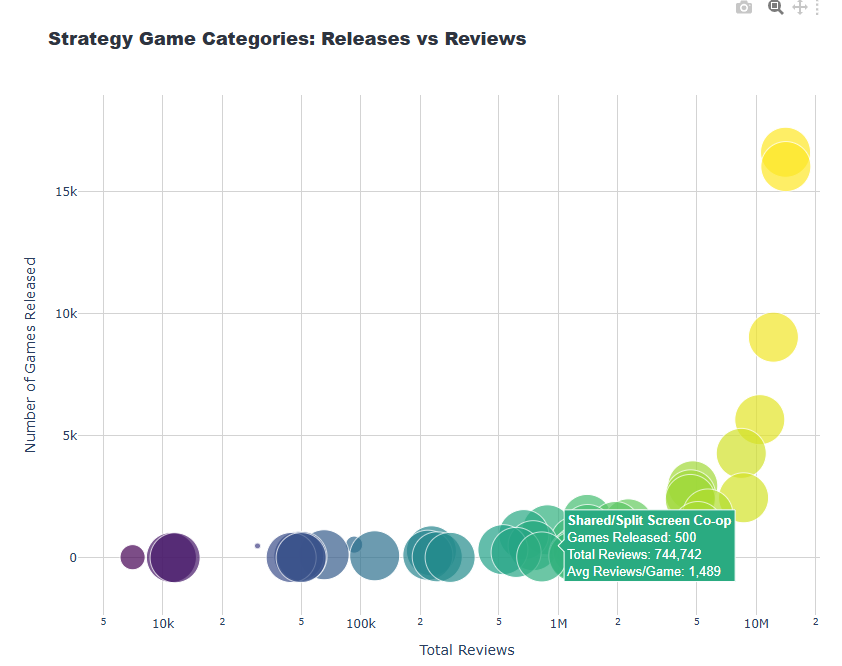
For this dataset, I played with Steam API data, available in Kaggle as is. Need to mention that while that dataset is much bigger comparing to GOG.com, there still not so much space for some kind of predictions. Buuut, at least we still can build some trends based on available categories – this time I decided to play more with Plotly:
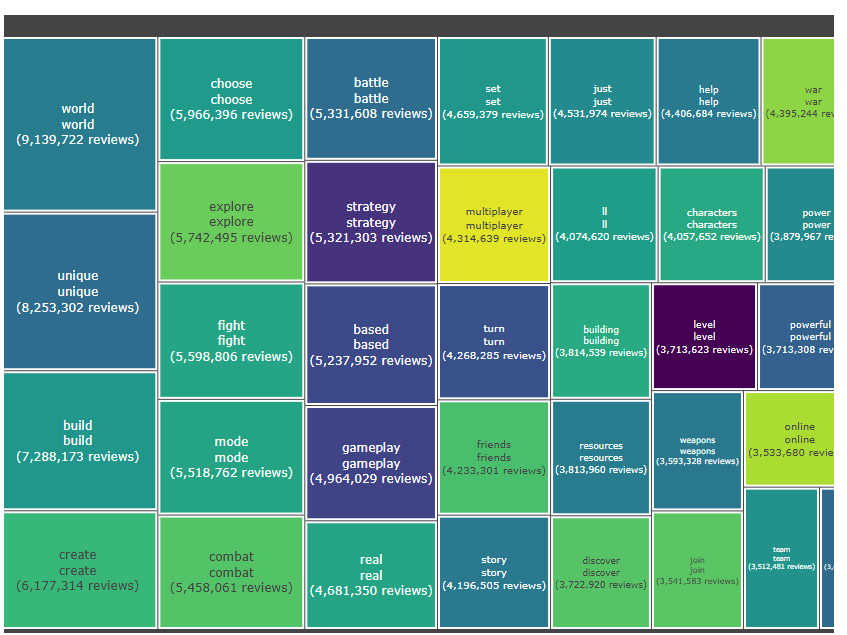
Also, I decided to utilize games descriptions, available in the dataset directly, with extraction of key words and phrases with the help of TF-IDF:
A Long Journey of GameCube
URL: https://www.kaggle.com/code/lunthu/a-long-journey-of-gamecube
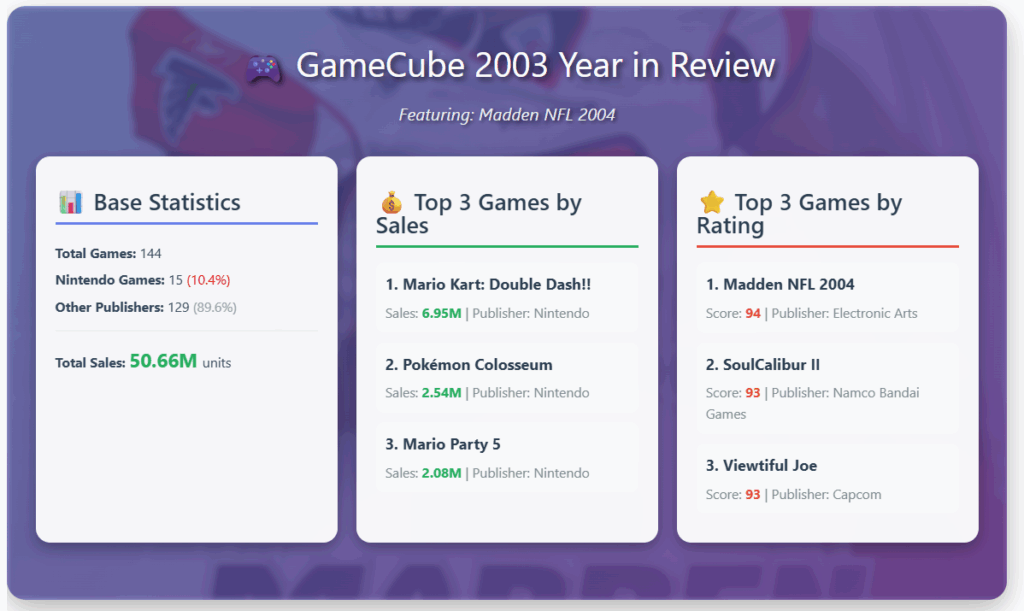
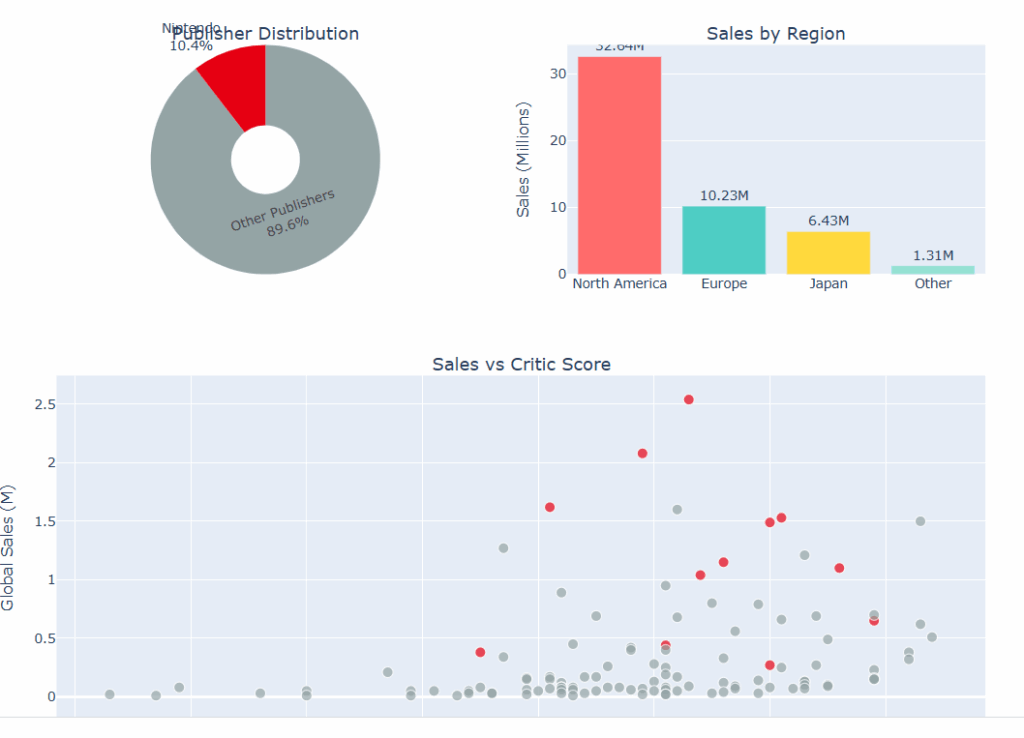
For the last notebook, I worked with VGChartz & Metacritic dataset. This time I decided to discover trends & patterns of GameCube era – comparing to other platforms of the same timeframe, and comparing to other Nintendo systems.
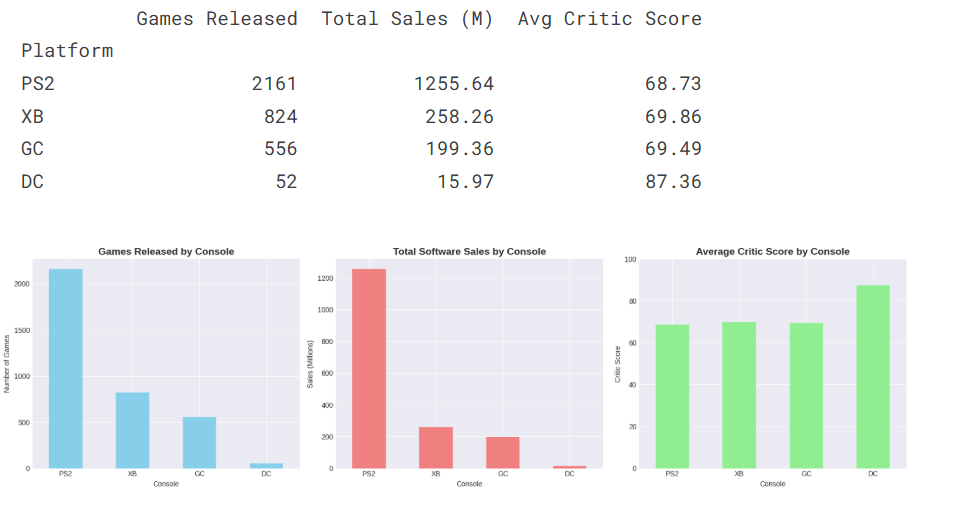
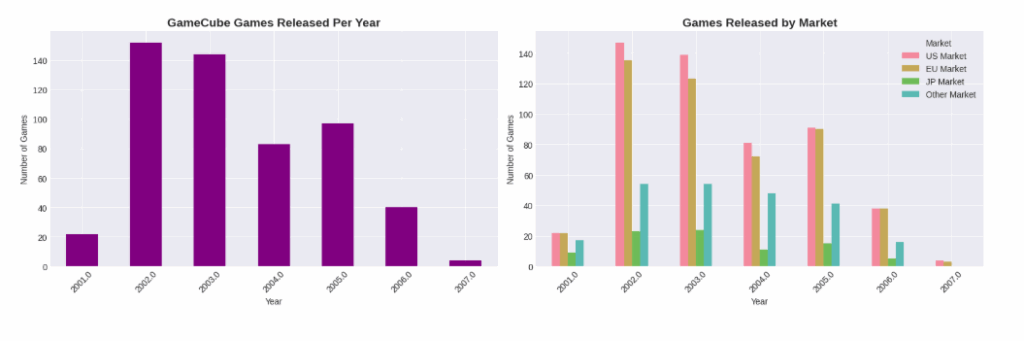
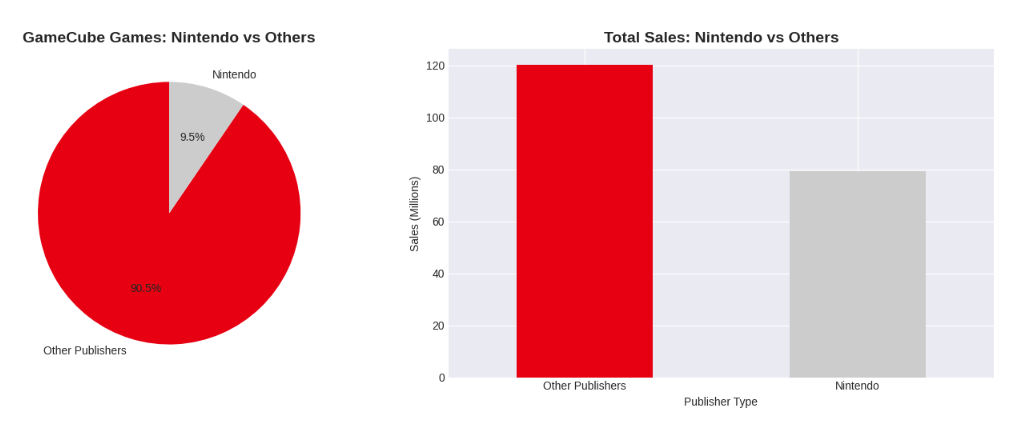
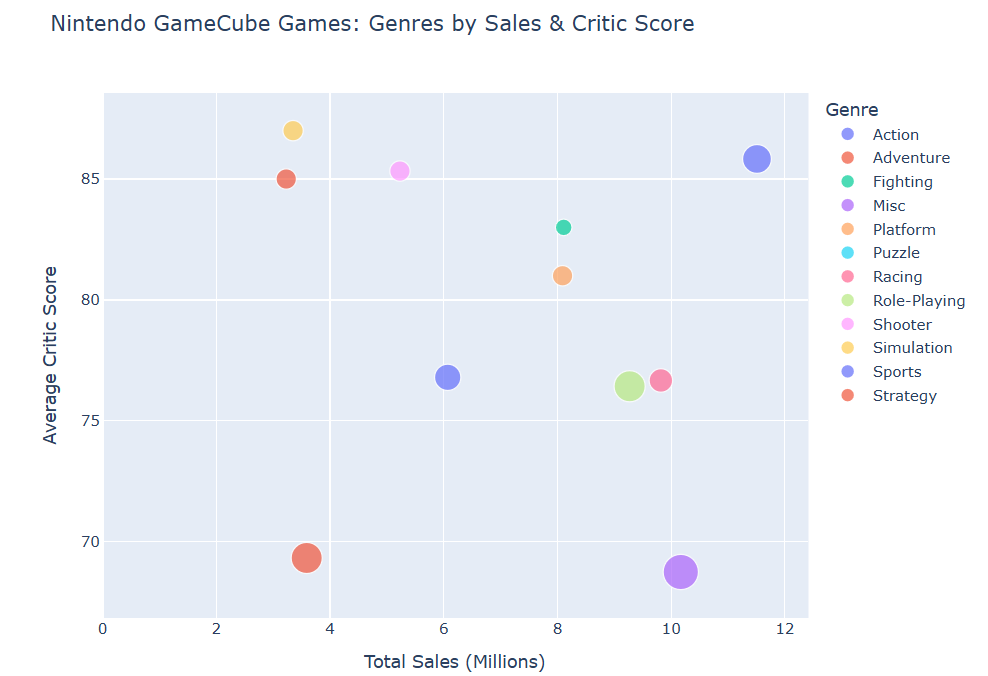
One interesting thing I decided to uncover in that dataset is to show the difference in game sales Nintendo vs other publishers, since the share of first-party games on Nintendo platforms is much bigger comparing to other consoles.
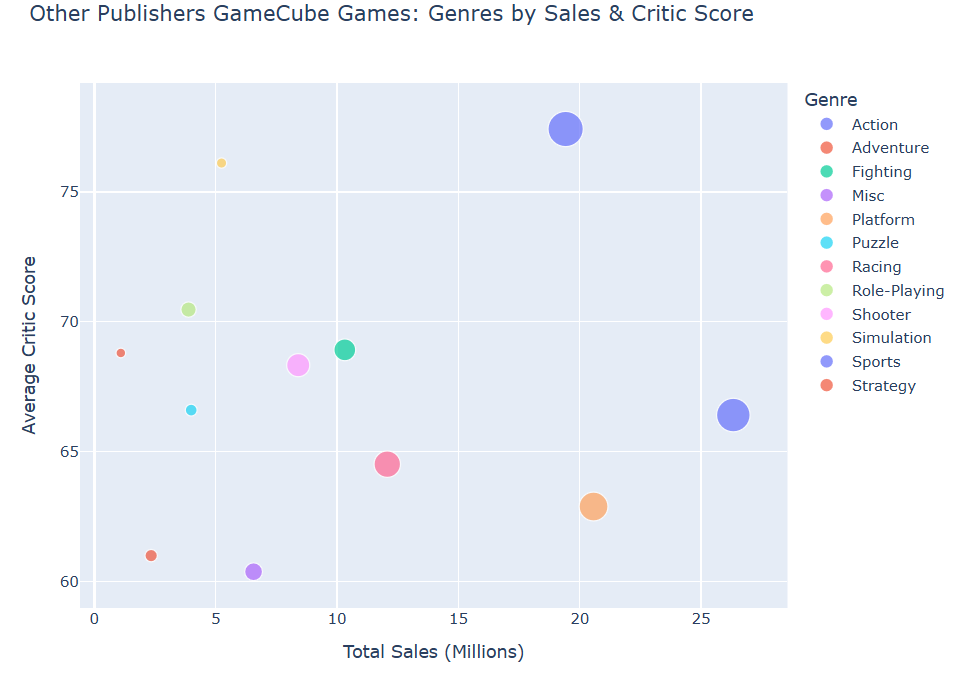
A special place in this notebook has year-by-year analysis of GameCube lifecycle – I decided to build HTML cards (with custom background images!) combined with Plotly charts. The funniest thing is 2003 – I never expected to see Madden NFL on the first place by critics score: